ELK Stack Parsing Apache Log Files
Anyone looking at log management for various reasons has probably heard the name ELK thrown around whenever the conversation turns to open source solutions. This stack is composed of three different tools, Elasticsearch, Logstash, and Kibana which come together to form a pretty good tool for digging through various logs.
I found myself in need of a way to dig through a lot of logs for investigative purposes and of the solutions out there ELK seemed like the best solution for me right now.
Installing and configuring ELK, and the use of the platform itself are really out of scope for this post. Let me just say that if you have not used ELK before, you will spend several hours or more getting to know the basics, while powerful and more straight forward than many other solutions, it can still be challenging.
Presuming you have a properly configured installation, I’m going to cover the specific needs in order to take a flat Apache access log file and import it into the ELK stack for further analysis.
1. Get your Apache log file onto the system where you have Logstash installed. FTP, SCP, copy-pasta, whatever you need to do to get it there. Oh, and if this is a file originating on Windows, you may need to do a dos2unix conversion on the file. I’m mentioning that because I’ve had some instances where this has been needed with other tools.
2. Once you have the log file, you’re going to need to create a config file specifically for Logstash that tells it what file to open, what to extract from the file, where to send the data, and how to handle that data.
- You can put the config file any place you like as long as you have access to call it.
- I would name it something like logstash_apache_file_import.conf
- These directives are for the current release and definitely won’t work right for anything less than 2.0.
- You have the option to split the index file or keep it monolithic. If you’re just doing this as a one-off, I’d really recommend not splitting. You can run into some problems if it splits up the logs too far. In my first attempt, I split the file by day had to wipe the imported data and start over.
The contents of the file should look like this:
input {
 file {
 type => "apache_access"
 path => "/path/to/log/access.log"
 start_position => "beginning"
 }
}

filter {
 grok {
 match => { "message" => "%{COMBINEDAPACHELOG}" }
 }

date {
 match => [ "timestamp", "dd/MMM/yyyy:HH:mm:ss Z" ]
 }
}

output {
 elasticsearch {
 hosts => ["elasticsearch.host:9200"]
 #split by day
 #index => "my_index_name-%{+YYYY.MM.dd}"
 #monolithic index
 index => "my_index_name"
 }
}
For a quick explanation, the input section instructs Logstash where to look for the file, what type of file it will be parsing, and where to start. If for some reason the parse doesn’t finish or goofs up, you may need to remove the cache file for where it stopped which is stored in .sincedb_#### in the root of the directory you ran the command in.
The second section deals with filtering. In this case, you’ll use grok to parse the Apache log file into it’s component pieces and then call out the timestamp since that is what you’ll likely index on.
The final section you’ll tell Logstash that you’re wanting to send this information directly into Elasticsearch so you can view it and work with it through Kibana. The most important part of this could be setting up your index name. This will help you identify the imported logs in the Kibana interface when you create your index.
3. Now you’ll need to do the actual import by running Logstash through the following command:
/path/to/bin/logstash -f logstash_apache_file_import.conf
This should run and start importing your logs which you’ll be able to start seeing coming into the Kibana interface. However, a few tips in the event that you have trouble. the -t directive before the -f directive will test your config to make sure the syntax is valid (it will not however, test whether your directives will be successful). Besides this, if you run into significant trouble, you might need to issue a –debug directive which will give you some pretty serious detail into what’s happening behind the scenes.
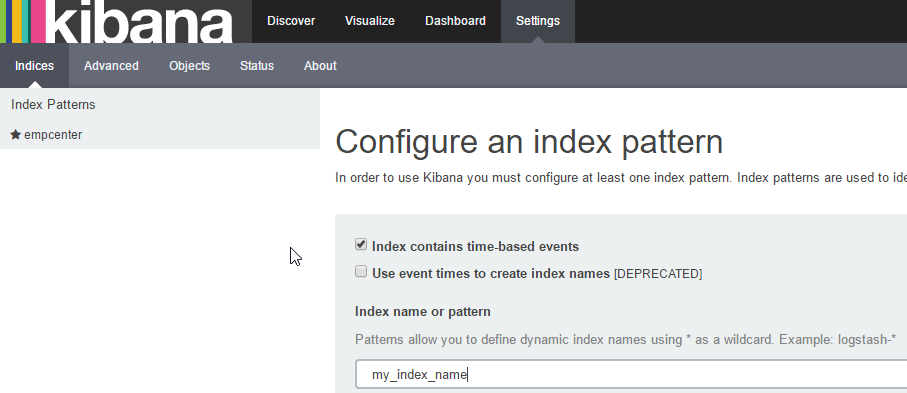
4. Last, as mentioned, it’s time to see it in Kibana. You’ll want to navigate to Settings and then Indices which gets you to where you can create your new one as shown below. Make sure to choose @timestamp in the drop down. If you don’t see that as an option, it’s likely something went wrong and you need to start Googling and troubleshooting.
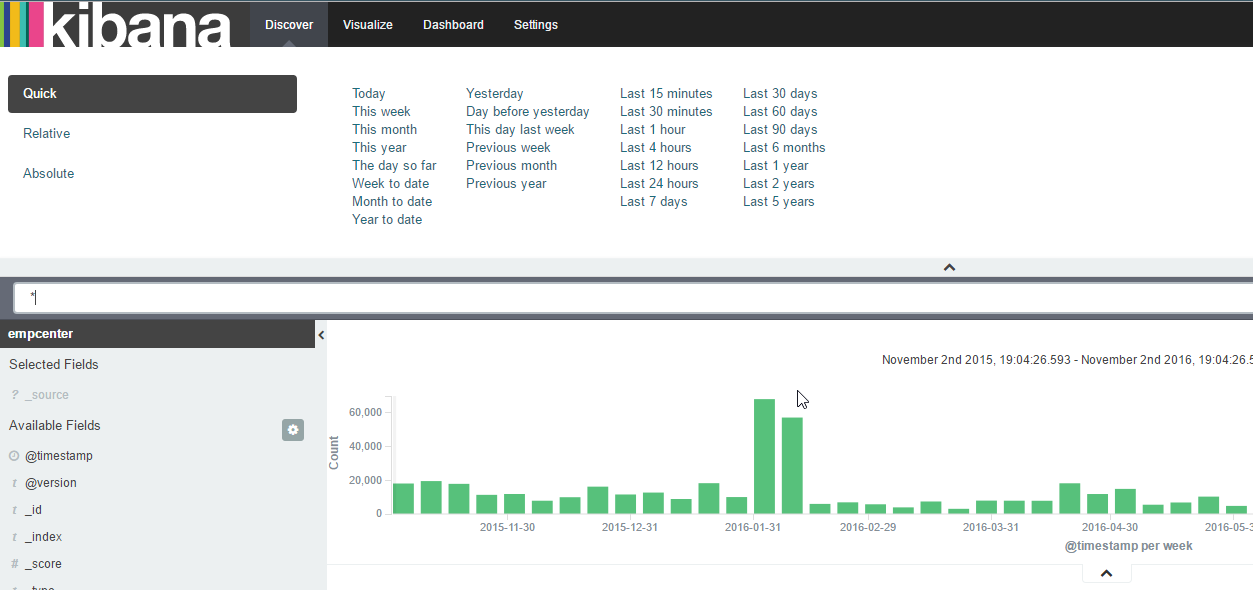
Once this is created, you should be able to see log entries and search them in the Discover section as shown below.


1 Comment
Torry Crass · November 3, 2016 at 4:50 pm
One additional note on this is that if you use a large number of indexes you may also need to adjust your ulimit. You can check this by simply issuing ulimit -n (search for other options or check the man page). I believe the recommendation is to set it to 65535 to avoid any problems. Adjust as appropriate for your system.